Alarms
A key functionality in the CoolSens system is the ability to send warnings and alarms when measurement values are outside the established limits. Effective management of these notifications allows for a quick response to adverse environmental changes, which is especially important in areas requiring strict climate control.
Introduction
- Warnings – These are sent when the temperature or humidity levels exceed recommended values but have not yet reached the alarm level. These warnings aim to alert users to potential issues, allowing for preventive actions to be taken.
- Alarms – These are generated in critical situations when the temperature or humidity levels exceed the set alarm thresholds. These alarms require immediate intervention to prevent damage to stored products, equipment, material degradation, or other adverse effects resulting from uncontrolled climatic conditions.
Sending alarms
When the warning threshold is exceeded (the optimal operating range is exceeded) or the alarm threshold is exceeded, the system records an alarm event.
Active alarms
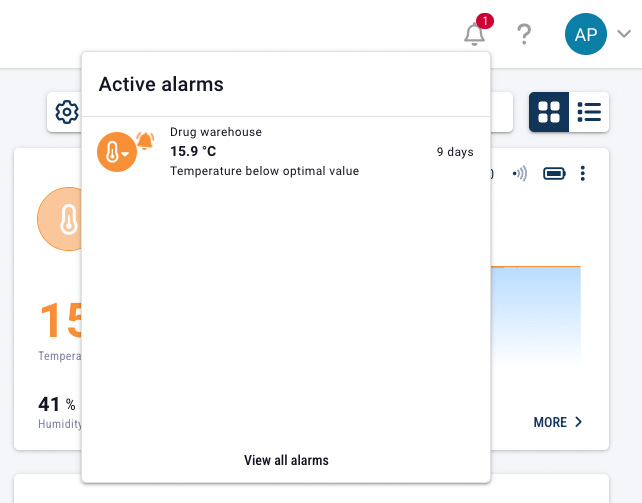
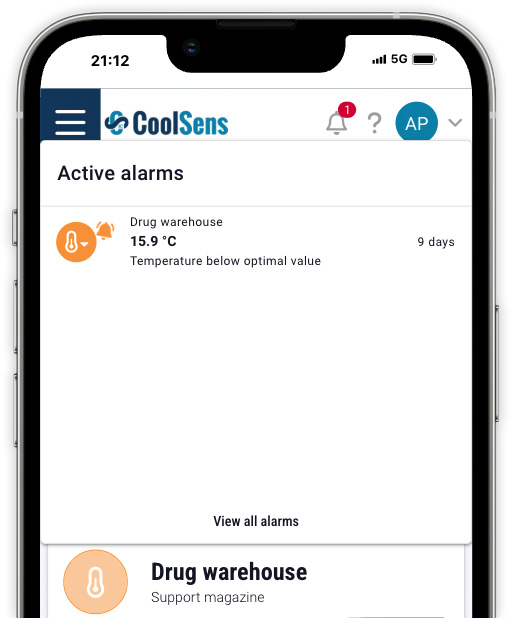
Clicking an alarm in the list will take you to the alarm list view, clearing all previously set filters and showing only active alarms.
Clicking on the View all alarms button will display a list of all alarms.
Notification channels
The CoolSens system offers three channels for sending notifications: e-mail, push (in the mobile application) and SMS.
E-mail and push notifications are free and are used by default to send all alerts.
SMS messages are a paid channel – to use them, you must purchase an SMS package and activate selected notifications. To start, each new account in the system receives a free package of 120 SMS messages to use.
Detailed information on configuring, viewing notifications and purchasing an SMS package can be found in the chapter on SMS notifications.
E-mail messages
Email notifications are one of the most commonly used forms of alarm communication in the CoolSens system. An email is automatically sent to the address assigned to the user account.
A notification will be sent to every user who has this option active when the alarm occurs.
SMS notifications
SMS notifications are a quick way to inform about alarm events, especially useful in situations requiring immediate response. The SMS message is sent to the phone number assigned to the user’s account.
A notification will be sent to each user with the SMS option activated when an alarm occurs.
Push notifications (Android)
Push notifications are sent directly to the CoolSens mobile app installed on an Android device. This is a convenient and free form of notification that only requires internet access.
To receive push notifications, the user must be logged into the app on their phone and have the appropriate system settings configured – including notifications for the CoolSens app enabled.
Notifications will be delivered to any mobile device that meets these conditions.
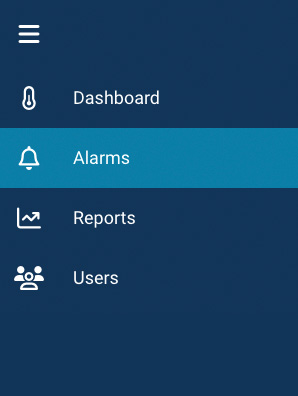
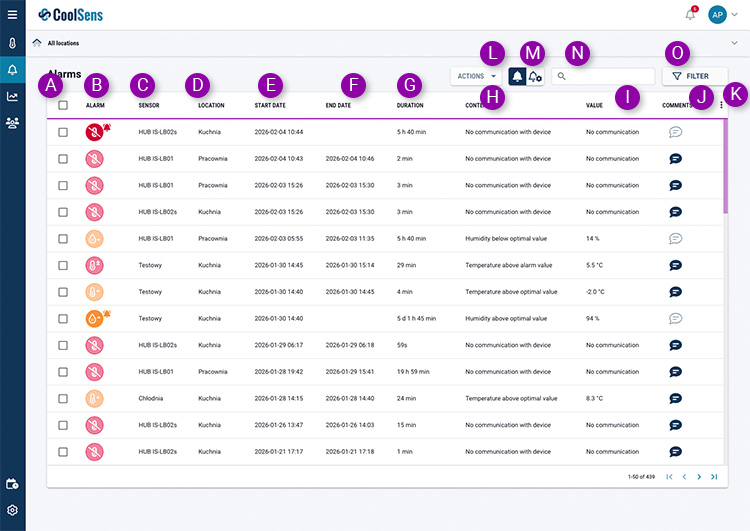
Alarm List
The alarm list is available from the main application menu (ALARMS command).
- Checkbox column – used to select alarms on which actions available in the top action bar will be performed, enabling simultaneous operations on multiple alarms (e.g. marking them as service actions).
- Alarm icon – an icon symbolizing the type of alarm and its status;
- Sensor, on which a value exceeding the warning or alarm threshold was measured;
- Location, where the sensor is located;
- Start date – date and time the alarm started;
- End date – date and time the alarm ended;
- Duration – duration of the alarm state;
- Content of the alarm notification (reason for sending it);
- Measured value;
- Comments – this button allows you to add and display a comment to the alarm. The dark color of the button means that a comment has already been added to the given alarm.
- The column selection button – allows the user to specify which columns are to be displayed in the table.
- Actions button – allows operations to be performed simultaneously on multiple alarms. The button becomes active after at least one alarm is selected using a checkbox.
- View switch – allows switching between the standard alarm list and the view of alarms marked as service actions.
- The searching field allows you to search for alarms that meet specific criteria;
- The button is used to filter alarms – you can indicate a specific device, parameter, location or alarm status.
Alarm icon
The alarm icon in the CoolSens system serves as an informational tool, providing key information about alarms that have occurred. It includes:
Alarm status – The icon indicates whether the alarm is still active or has already stopped.
 An active alarm is marked with an animated bell. Additionally, the icon is filled with an intense orange color (for warnings) or red (for alarms);
- the icon indicating an inactive alarm (the warning or alarm state has already passed) will be filled with a semi-transparent orange or red color; the bell icon will not be visible.
Alarm type– The icon indicates what the alarm is about:
 temperature,
 humidity,
 battery charge level.
Alarm threshold – indicates which threshold has been exceeded:
 upper alarm threshold,
 upper warning threshold,
 lower warning threshold
 lower alarm threshold.
Depending on the type and status of the alarm, the icon can take on different colors and shapes, allowing you to quickly orient yourself in the situation.
Alarm Notes
The application allows you to add notes to alarms, which allows for ongoing documentation of the circumstances of the event and actions taken. The user can add a comment to each alarm, which facilitates later analysis and event history.
Notes can contain additional information, such as the cause of the alarm, remedial actions taken, or other important details. Added comments are visible in the alarm details. They cannot be edited or deleted, it is only possible to add further notes to the alarm.
![]() To add a comment to an alarm, click the comments icon in the line with the alarm. If no one has added a comment before, a window will open to enter a comment.
To add a comment to an alarm, click the comments icon in the line with the alarm. If no one has added a comment before, a window will open to enter a comment.
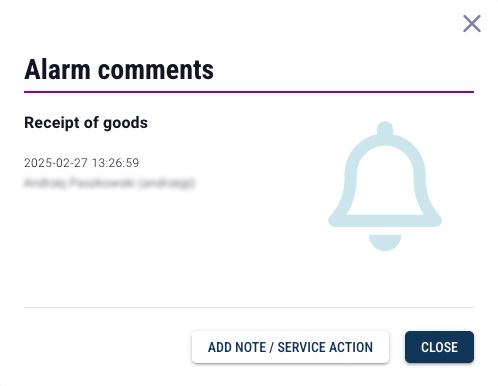
![]() If a comment has already been entered, you will be able to view it and add another comment to it.
If a comment has already been entered, you will be able to view it and add another comment to it.
Marking Alarms as Service Actions
Typical Use Cases
- maintenance or servicing of refrigeration equipment,
- defrosting freezers or refrigerators,
- planned shutdown of a device,
- testing of installations or sensors,
- temporary opening of cold storage chambers during loading or unloading.
Single Alarm Marking
To mark a single alarm as a service action:
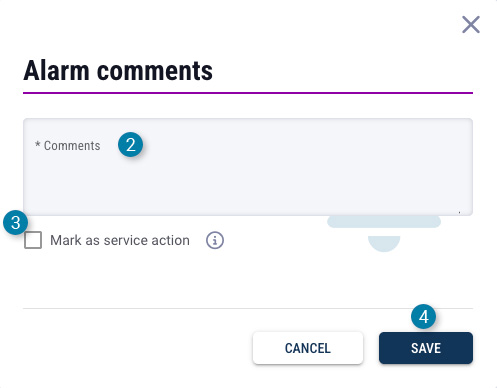
- Click the speech bubble icon next to the alarm to open the Alarm Notes window:

- Enter a comment describing the reason for marking the alarm as a service action.
- Select the Mark as service action option.
- Save the changes.
- the alarm is moved to the service actions list,
- it is not included in alarm statistics or reports,
- user comments are clearly marked with the note (service action).
Bulk Service Action Assignment
The system allows bulk marking of multiple alarms as service actions.
To mark multiple alarms:
- On the alarm list, select the relevant alarms using checkboxes.
- Click the ACTIONS button.
- Select Add note / mark as service action.
- In the dialog window, enter a comment.
- Select the Mark as service action option.
- Save the changes.
Restoring an Alarm from Service Actions
- Click the speech bubble icon next to the service action to open the Alarm Notes window:

- Enter a comment explaining the reason for restoring the alarm.
- Deselect the service action option.
- Save the changes.
- is no longer treated as a service action,
- reappears on the alarm list,
- is included in statistics and reports.
Bulk Alarm Restoration
Multiple alarms can be restored from the service actions list in the same way:
- Select the checkbox next to the chosen alarms on the list.
- Select ACTIONS → Add note / restore alarm.
- Add a comment explaining the reason for restoring the alarms.
- Deselect the service action status.
- Save the changes.
Sorting, filtering and searching
Alerts are displayed in chronological order by default. You can sort them by the selected column by clicking on its header. Clicking the column header again will change the sorting order.
- The search field allows you to filter the alarm list – you can enter a fragment of the sensor name, date/time, measured value – the system searches for the entered phrase in all columns.
- The filtering functionality allows you to display events with a selected status from selected sensors or only those related to temperature or humidity.
Each item in the list represents a received alarm or notification and contains information such as:
- Alarm icon – check its meaning above;
- Sensor name, measuredvalue, notification content and date and time of receiving the notification;
- Details about the alarm – measured value, cause of the alarm, date and time of its start and end.
- Button for adding and reviewing comments to the alarm.
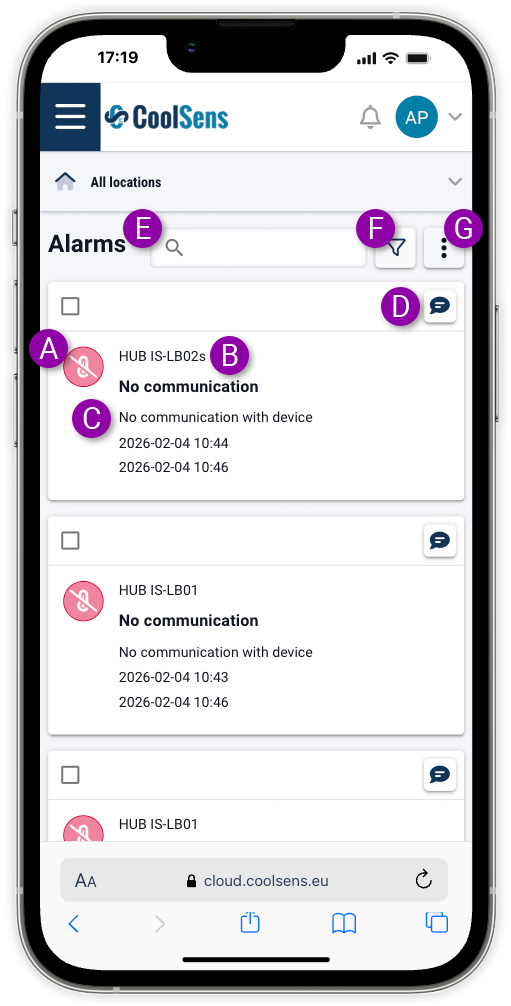
- Search field allows you to filter the alarm list – you can enter a fragment of the sensor name, date/time, measured value – the system searches for the entered phrase in all columns.
- Filter functionality allows you to display events with a selected status from selected sensors or only those related to temperature or humidity.
- The More button opens a menu with additional options, allowing you to switch between the standard alarm list and alarms marked as service actions, as well as select all alarms and perform bulk actions on the selected items.
Alarm details
Clicking on the selected alarm position on the list will open a window in which a graph will be displayed showing the value of the monitored parameter on the day the alarm occurred.
Thanks to this, the user can quickly analyze changes in a given value and identify any irregularities in the monitored environment.
Archiving alarms
As you use the system, the list of alarms can grow. If you don’t want inactive alarms to be visible, you can archive them.
- The ARCHIVE button at the end of each row is used to archive the specific alarm. It will no longer appear on the list but will not be deleted from the account history and will be visible in the alarm report.
- If you want to archive multiple alarms at once, select the desired rows using the checkbox in the first column of the table and click the ARCHIVE SELECTED button. Click the checkbox in the column header to select all alarms on the current page of the table.
- The ARCHIVE button at the end of each row is used to archive the specific alarm. It will no longer appear on the list but will not be deleted from the account history and will remain visible in the alarm report.
- If you want to archive multiple alarms at once, select the desired items using the checkbox in the alarm header and click the Archive selected option available in the menu under the button with three vertical bars. This menu also contains the Select all option, which selects all alarms visible on the displayed page of the table.
SMS notifications
SMS notifications supplement the basic channels for reporting alarm events in the CoolSens system. Due to their independence from the Internet and high delivery speed, they are particularly useful in situations requiring immediate response – e.g. in the event of failures, exceeding alarm thresholds or loss of power.
Using SMS notifications requires meeting several conditions:
- Having an active SMS package (more information in the Orders section),
- Activation of SMS notifications for selected events (Configuration section).
- Enabling the option to send alarm notifications via SMS in the user profile (more information in the chapter on User Profile).
In this chapter you will find information on:
configuring SMS notifications for the system account,
reviewing the history of sent messages,
monitoring available limits,
purchasing additional SMS packs.
SMS notification configuration
To configure SMS notifications in the system, follow these steps:
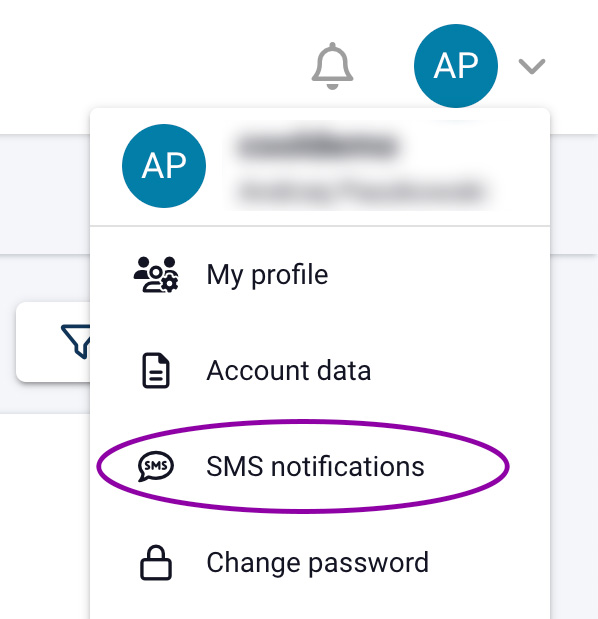
- Open SMS settings – click on the user avatar located in the upper right corner of the application, then select SMS notifications from the drop-down menu.
- Go to the CONFIGURATION tab – in the new window go to the CONFIGURATION tab.
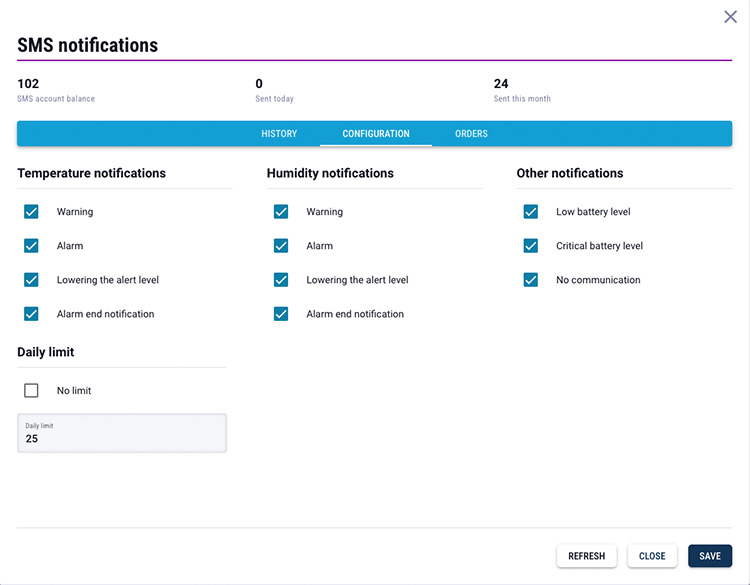
- Select events for SMS notifications – in the configuration tab, select the events for which you want to send SMS in addition to email notifications.
- Set daily limit (optional) – to control costs, you can set a daily limit for the number of SMS messages sent (the default is 10). If you do not want to set any limit, select No limit.
- Save settings – after making all changes, click the SAVE button to save the configuration.
Your settings will be applied immediately and the system will start sending SMS notifications according to the selected configuration.
Overview of sent SMS notifications
All sent SMS notifications can be viewed in the HISTORY tab, accessible from the SMS Notifications window.
To open this window, click the user’s avatar in the application header, then select SMS Notifications from the drop-down menu.
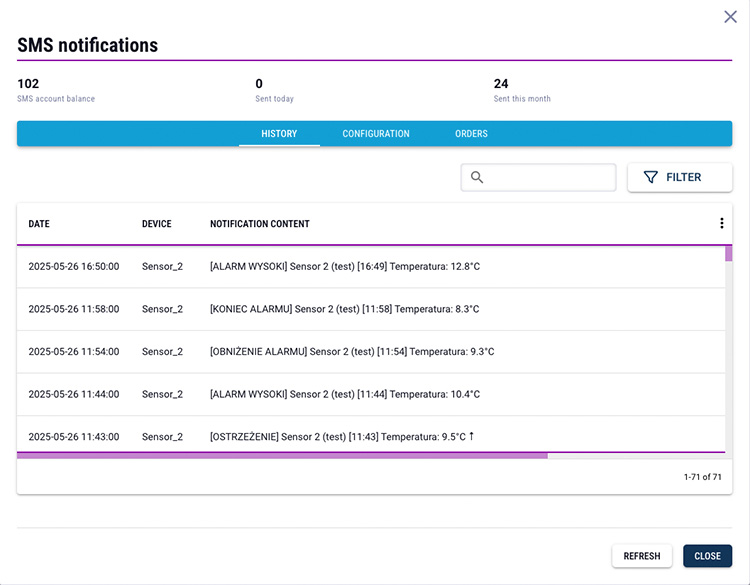
The HISTORY tab contains a list of all SMS messages sent by the system to devices located in locations to which the given user has access.
Similarly to other tables in the system, the user can customize the table view by selecting columns to display (by clicking the three dots icon in the table header).
There is a message filtering function available, including:
- by device that generated the alarm,
- by message content – it is possible to search for any text fragment.
Orders
In the ORDERS tab, available in the SMS Notifications window (menu after clicking the avatar in the application header), the administrator can:
- view the history of SMS package orders,
- order new SMS packages,
- check the current status of the SMS account, which is displayed at the top of the window.
Purchases are made through an integrated online store, and payment is made in a secure, external payment system.
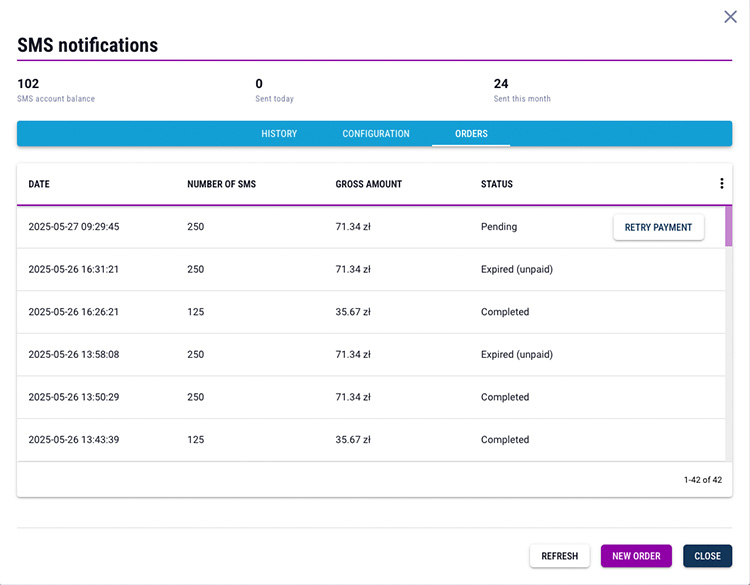
Order overview
The ORDERS tab allows system administrators to view the history of all placed SMS package orders. The table with orders contains, among others, the following information:
- Order date – the time the order was placed in the system,
- Number of ordered SMS messages – the product of SMS messages in the selected package and the number of ordered packages,
- Package cost – net and gross amounts of the order,
- Ordering party – the user who placed the order,
- Order status – current status of fulfillment. Possible order statuses:
- Pending – the system is waiting for payment confirmation from the store,
- Completed – the payment was successfully completed and the package was activated,
- Expired (not completed) – the payment was not finalized within 30 minutes of placing the order.
Similarly to other tables in the system, the column view can be customized by clicking the three dots icon in the table header. This allows you to choose which information is to be displayed according to the user’s preferences.
New order
To place a new order for an SMS package, follow these steps:
- Open the SMS notifications window – click on the user avatar in the upper right corner of the application, then select SMS notifications from the menu.
- Go to the ORDERS tab.
- Click the NEW ORDER button to start the new order process.
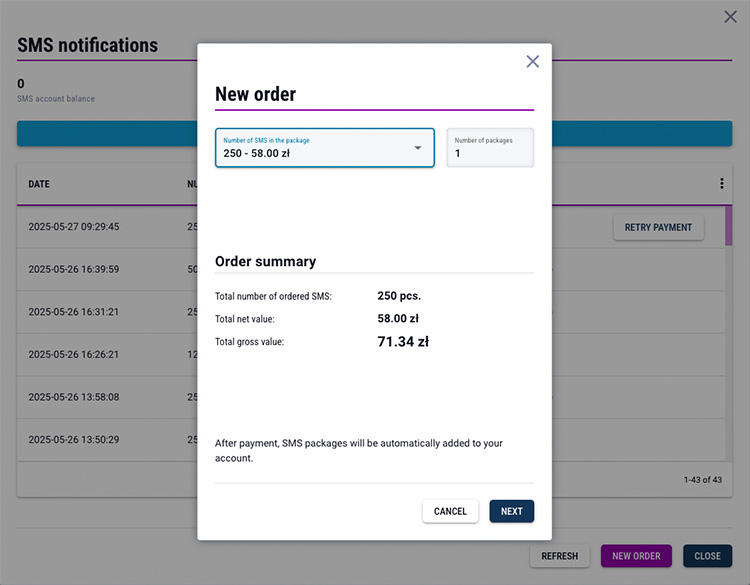
- Select package and number of pieces – from the available list, select the SMS package you want to order and the number of packages you want to purchase. After making your selection, click NEXT.
- Check the ordering party’s data – the form with the ordering party’s data will be automatically filled in based on the information saved in the account settings and user data. Verify the correctness of the data.
- Click the GO TO PAYMENT button – you will be redirected to an external store where you should finalize the purchase.
- Make payment in the store – in a new browser window, follow the store’s instructions to make the payment. After completing the transaction, close the store window and return to the CoolSens app.
- Check order status – Your order will appear in the order table. After successful payment, its status will automatically change from Pending to Completed and your account will be topped up with the purchased number of SMS.
SMS account status and sending statistics
Information about the SMS account status and current message usage is available in the SMS Notifications window (to open it, select the SMS Notifications command available in the drop-down menu after clicking the avatar at the top of the screen).
In the opened window, at the top, three key values are presented:
- SMS account balance – the pool of SMS notifications that can still be sent from the account,
- Sent today – the number of SMS messages sent on the current day,
- Sent this month – the number of messages sent since the beginning of the calendar month.
To refresh the statistics and check the current values, click the REFRESH button next to the indicators. The system will download the latest data from the server and update the visible numbers.
SMS notification status
In the CoolSens system, information about the availability of SMS notifications is signaled by an icon visible on the top bar of the application. The icon changes appearance depending on the current status of the SMS account and can take one of the following forms:
![]() Crossed-out SMS icon
Crossed-out SMS icon
Means that SMS notifications will not be sent for one of two reasons:
- the daily sending limit has been reached,
- the entire pool of available SMS messages has been exhausted.
The daily limit will be automatically renewed after midnight.
If the SMS pool is completely exhausted, it is necessary to purchase a new package to resume sending messages.
![]() SMS icon with exclamation mark
SMS icon with exclamation mark
Appears when the number of remaining SMS drops to 30 or less. This is a warning signal that is intended to inform the user about the low balance of the account and encourage them to buy a new package before it is completely exhausted.
Interactions with the icon
Mousing over the icon will display a short description (bubble) that explains what the status means.
Clicking the icon opens the SMS Notifications window, where you can:
- check current statistics,
- change the set daily limit,
- purchase a new SMS package.