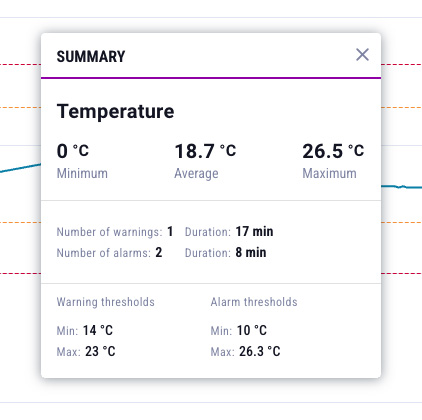
- Sensor status allows for the evaluation of measured parameters and determination of the device status (more information).
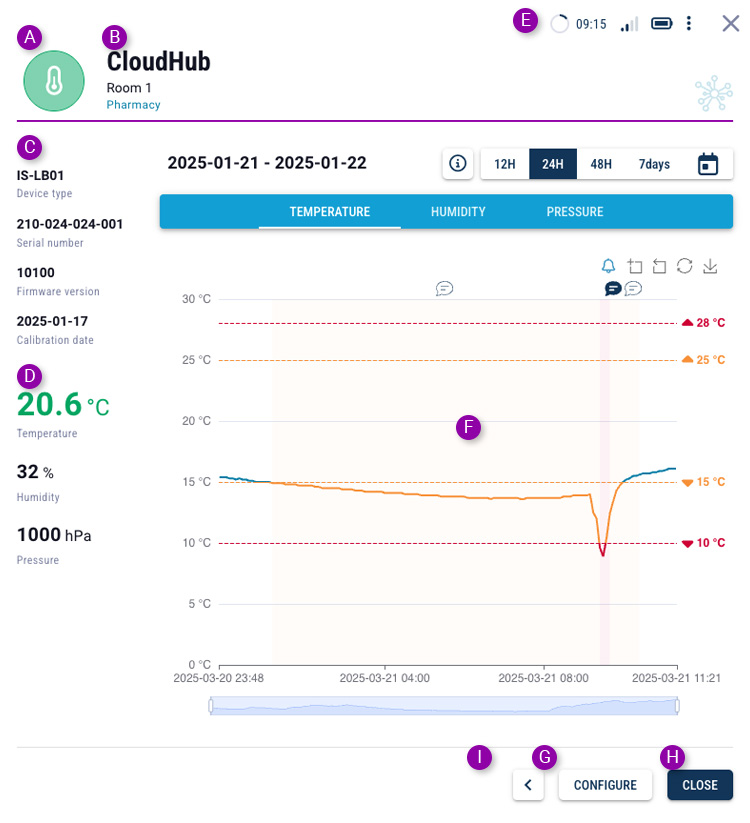
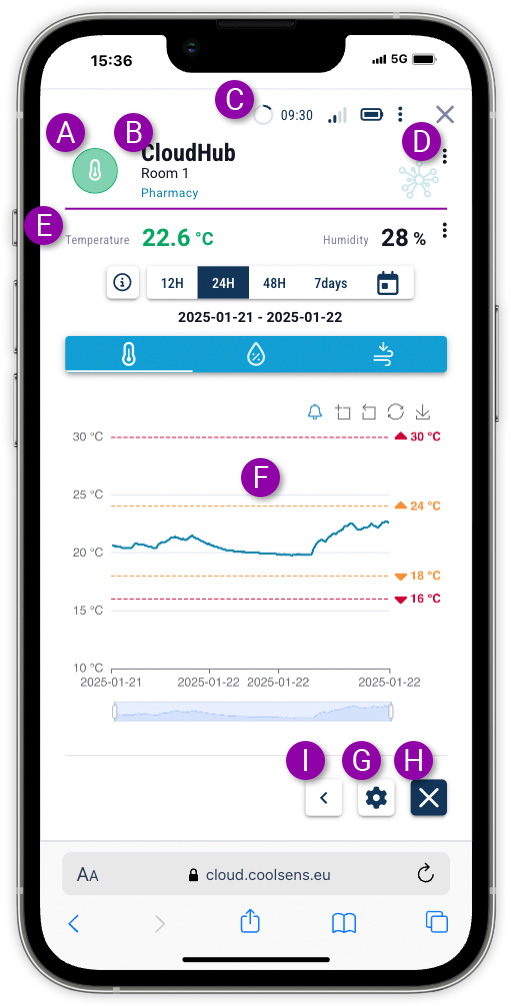
- Device name (and additional description), which can be assigned by the User.
- Status bar providing information, similar to the dashboard tile, about the data’s recency, radio signal strength, and device battery voltage.
- Device type, its serial number, firmware version and certification date (if added)- visible by clicking the menu available through the three-dot button. For CoolSens Node sensors, the name of the hub the sensor is paired with is also displayed.
- Current values (last transmitted) of the parameters measured by the device: temperature, humidity, and for concentrators, also atmospheric air pressure.
- Chart area displaying selected data transmitted from the device over a chosen time period. More details on using the chart can be found later in this chapter.
 The configuration button opens the device configuration form. It is only visible to Users with the appropriate permissions.
 The close button returns to the dashboard view.
 The more button lets you access less frequently used features, such as moving your device to another location.
All CoolSens Node sensors must be connected to a hub in order to send measurement data to the system.
![]() To view a list of sensors paired with a specific hub, click the PAIRED SENSORS button, which can be found after clicking the button that slides out additional buttons.
To view a list of sensors paired with a specific hub, click the PAIRED SENSORS button, which can be found after clicking the button that slides out additional buttons.
All CoolSens Node sensors must be connected to a hub in order to send measurement data to the system.
![]()
![]() To view a list of sensors paired with a specific hub, click the PAIRED SENSORS button, which can be found after clicking the button that slides out additional buttons.
To view a list of sensors paired with a specific hub, click the PAIRED SENSORS button, which can be found after clicking the button that slides out additional buttons.
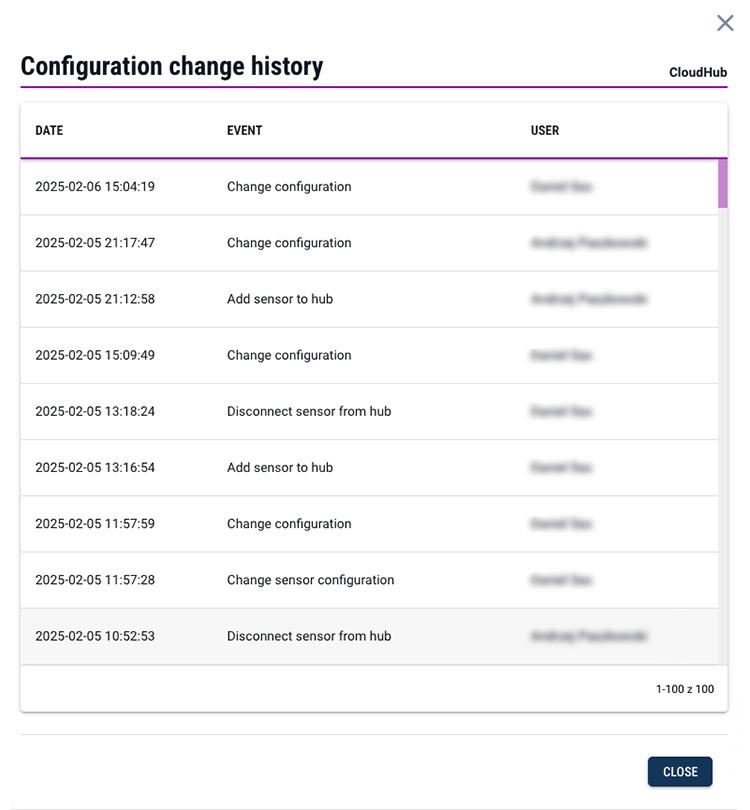
![]() To view the change history, first click the additional features slide-out button and then select CHANGE LOG.
To view the change history, first click the additional features slide-out button and then select CHANGE LOG.
![]()
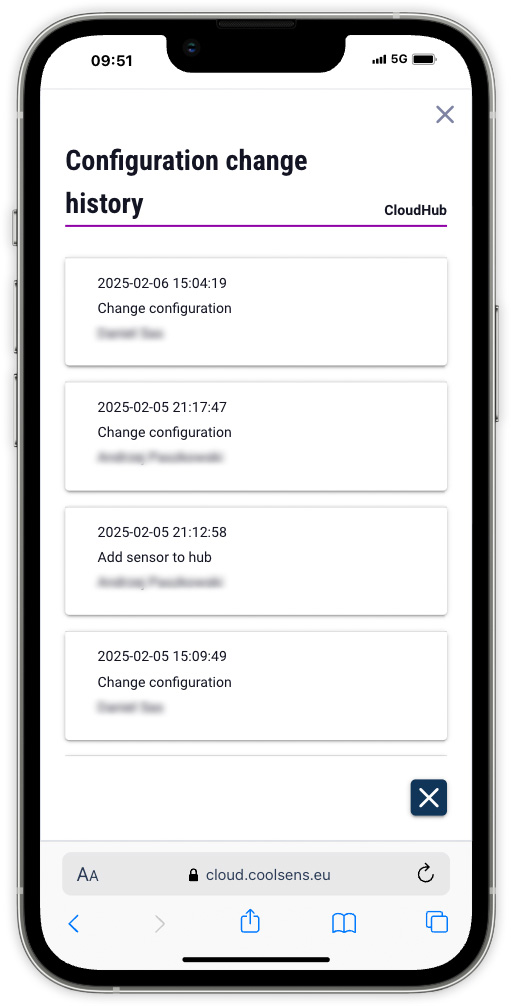
![]() To view the change history, first click the additional features slide-out button and then select CHANGE LOG.
To view the change history, first click the additional features slide-out button and then select CHANGE LOG.
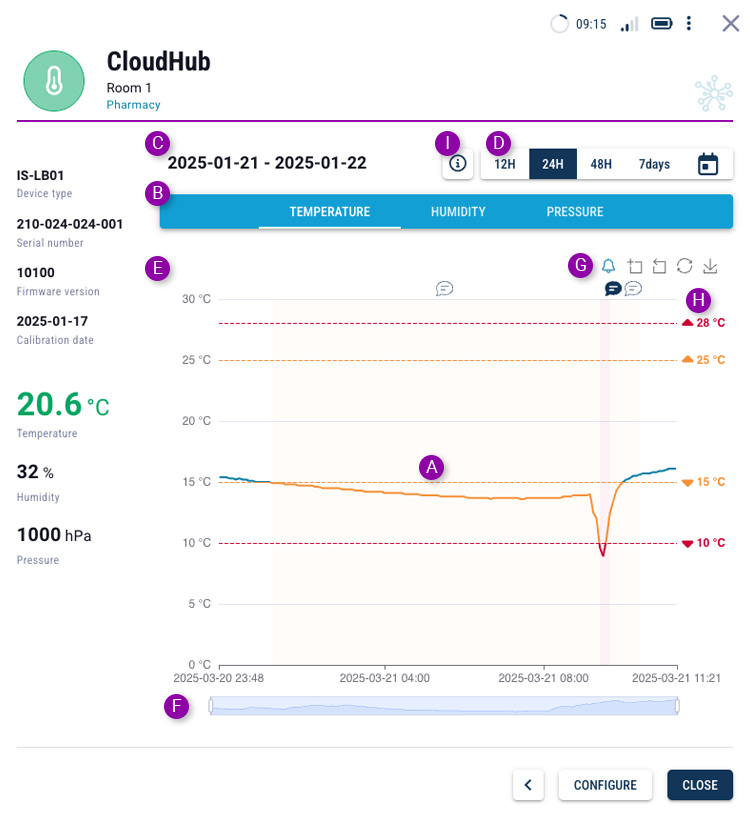
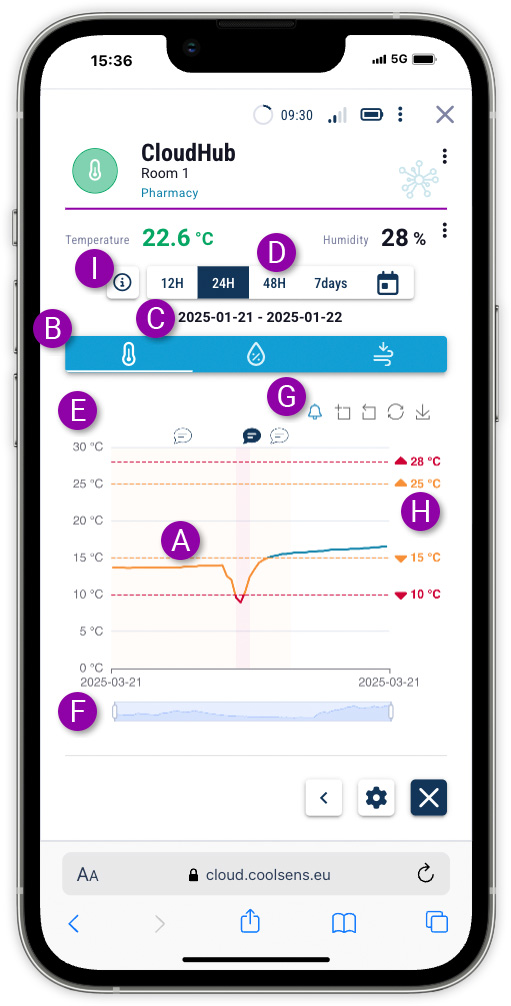
![]() This button toggles the visibility of alarm areas on the chart.
This button toggles the visibility of alarm areas on the chart.
![]() Clicking the button with the plus icon allows you to select a portion of the chart to zoom in.
Clicking the button with the plus icon allows you to select a portion of the chart to zoom in.
![]()
![]() The next buttons allow you to undo the zoom and reset the chart scale.
The next buttons allow you to undo the zoom and reset the chart scale.
![]() The last button allows you to download the chart as a PNG file.
The last button allows you to download the chart as a PNG file.